Objectives
· Using Elevation and Slope Profiles
o Could we identify the sources of flows which form the fans?
o Could we classify the recent flows and the older slopes
o Could we classify relatively recent fans from old fans
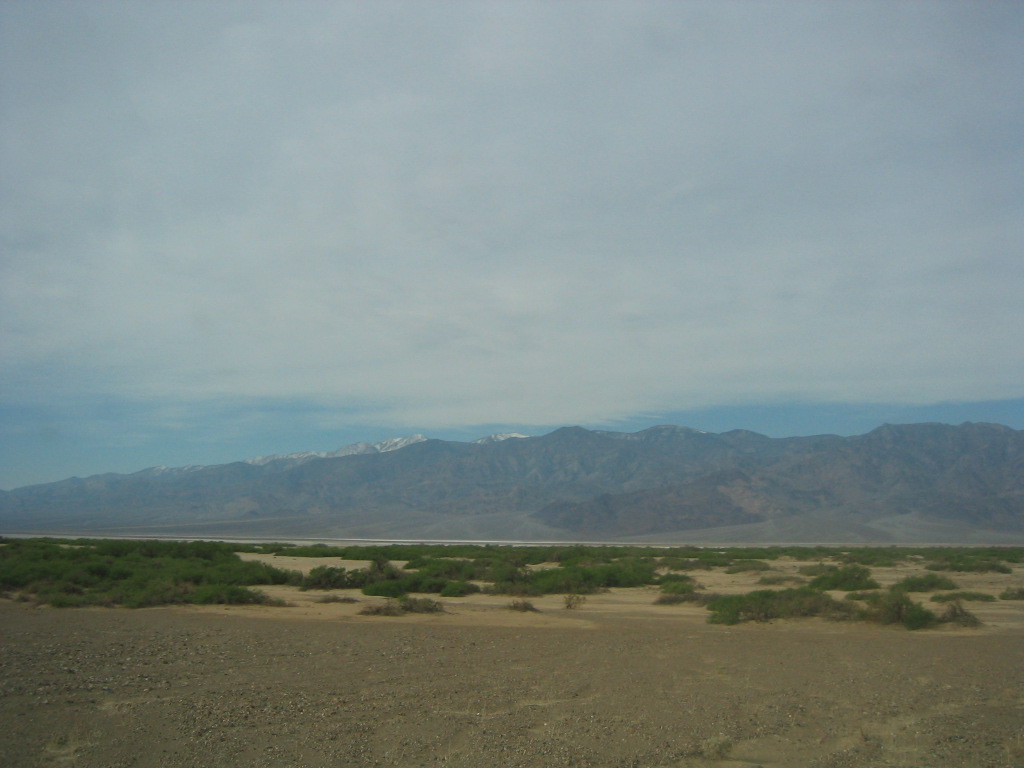
o Find major features of the Fans flanking the Panamint Mountains and the Black Mountains
· Classification of Fans using Unsupervised GIS Classification of Aster Data
· Deccorrelation Stretch of the Aster Data to Study the Fans
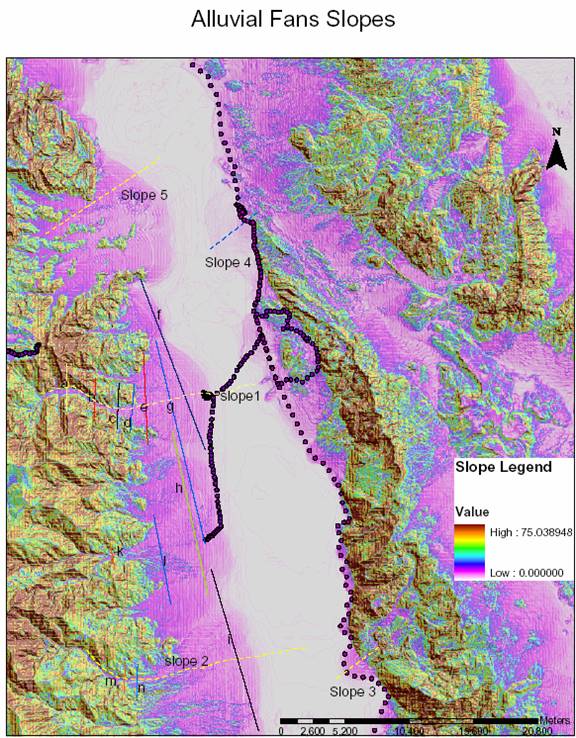
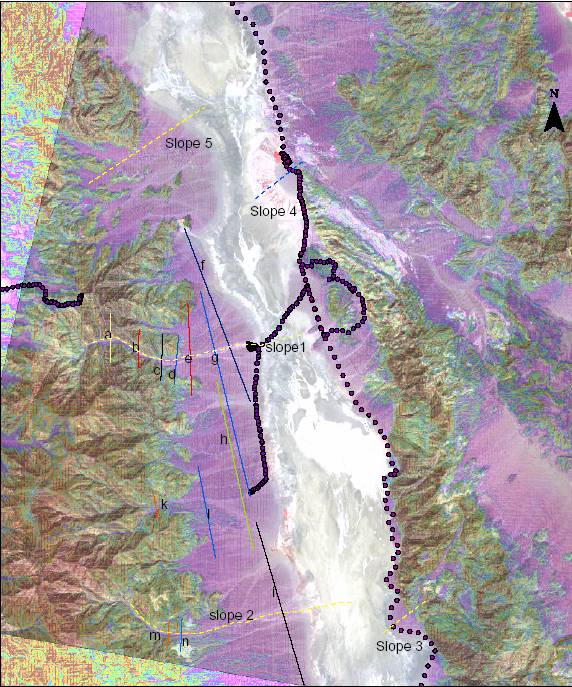
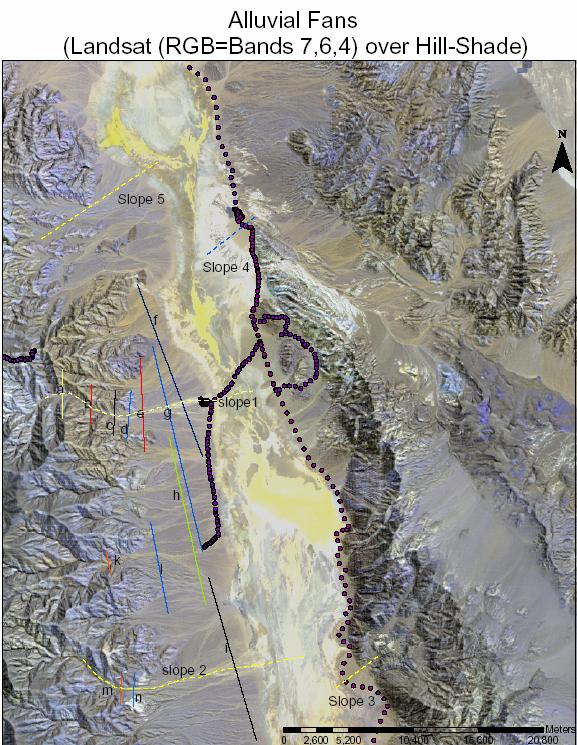
Fan Elevation and Slope Profiles:
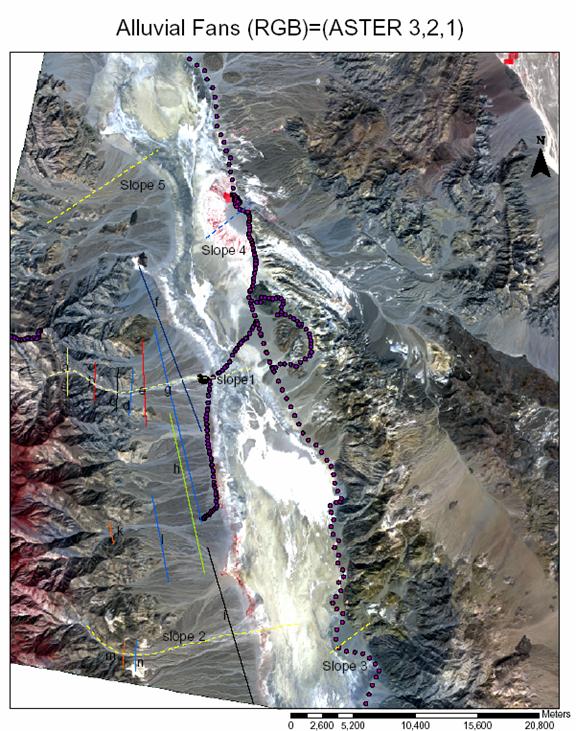
A slope profile was created for the area of interest. Our GPS data is overlaid on the image and represented by dots. We observe the following:
· Alluvial Fans have small slopes with their slopes varying from small slopes ranging from 2-5 degrees.
· Lower Alluvial Fan Slopes are represented by light pink and higher Slopes by Dark Pink.
· Black Mountain Fans (to the east ) have lower Slopes (light pink) than the Panamint Mountain Fans(to the west). This is mainly due to the tilting of the Death Valley Block eastwards.
· The Panamint Mountain Fans are much larger than the Black Mountains Fans. This is because the Panamint Mountains are higher with peaks to 11,000 feet high as the Telescope Hill while the Black Mountains peek only to the 6,000 feet high. Black Mountains are in the rain shadow of the Panamint Mountains. The later has thus more water sources for building fans.
Overlaying a Contour Map on Aster Data (RGB=3,2,1) with transparency 50%
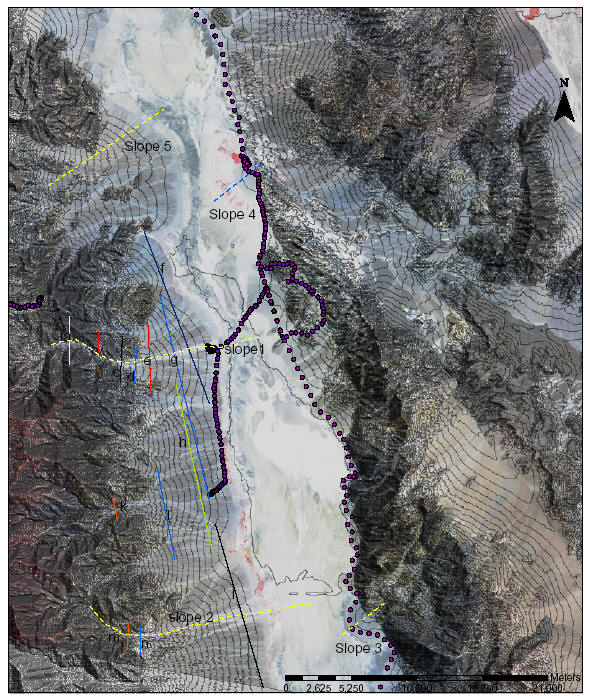
Overlaying the Slope Profiles on Aster Data with transparency 50%
· Recent Fans (as those flanking the Black Mountains) are nicely shaped with a convex radial profile and are smaller in size.
· Fans flanking the Panamint range are formed from multiple flows overlaid and overflows from nearby fans.
· Recent flows could not be identified in general from old flows using the Elevation and Slope profiles.
· Recent and Old flows could be identified however using
o The surface roughness
o The degree of desert varnish
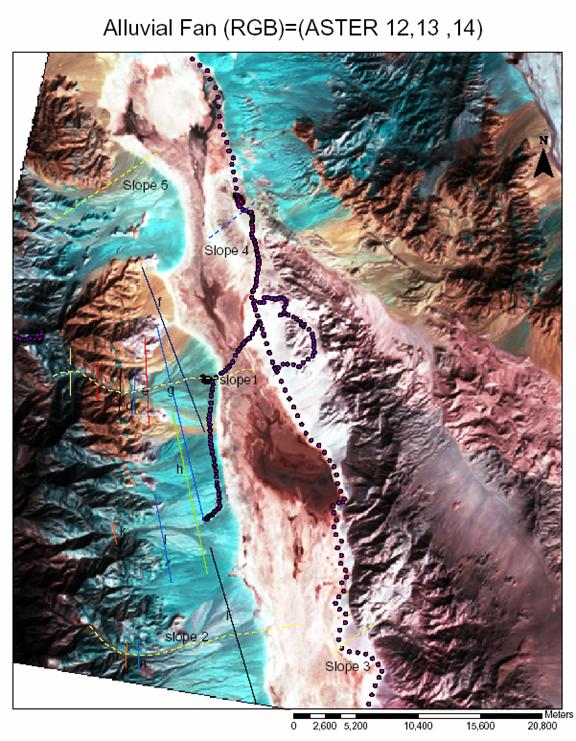
Classification of Fans using the Aster Data:
The following image shows the ASTER data in the Thermal IR:
· The bands are band 12::8.925-9.275 microm,13::10.25:10.95 microm, band 14:: 10.95:11.65 microm
· The Panaminent Alluvial Fans appear in blue. The dark blue represents the recent flows where the lighter blue represents the older flows.
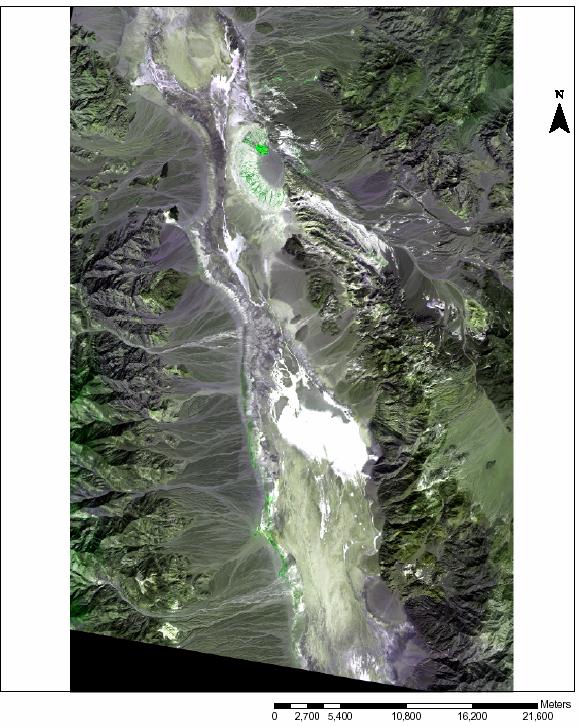
The following image shows ASTER data in the Visible Near IR bands 3,2,1:
· The western and eastern Alluvial Fans appear grey in color.
· Vegetation at the Furnace Creek fan appears in red.
· The recent flows are lighter in color than the older flows
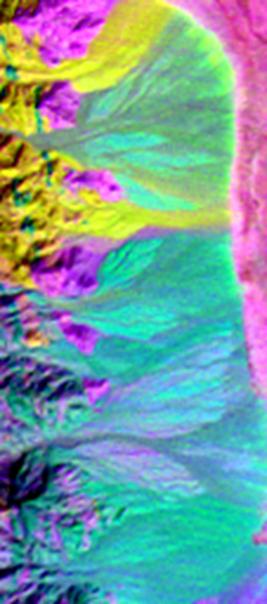
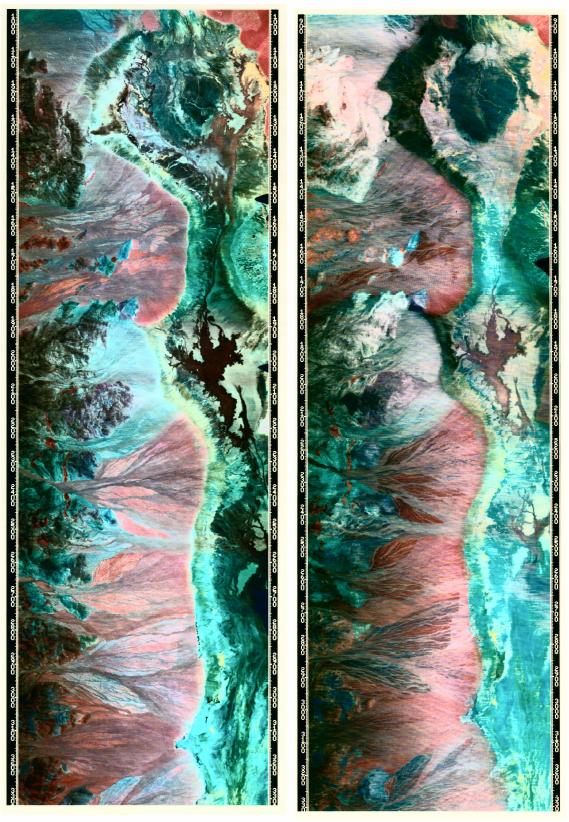
Decorrelation Stretch of ASTER (3,2,1) Data:
The Interfan Shallow areas appear in Yellow. The older fan portions appear to be bright green where as the recent flows tend to be dark green.
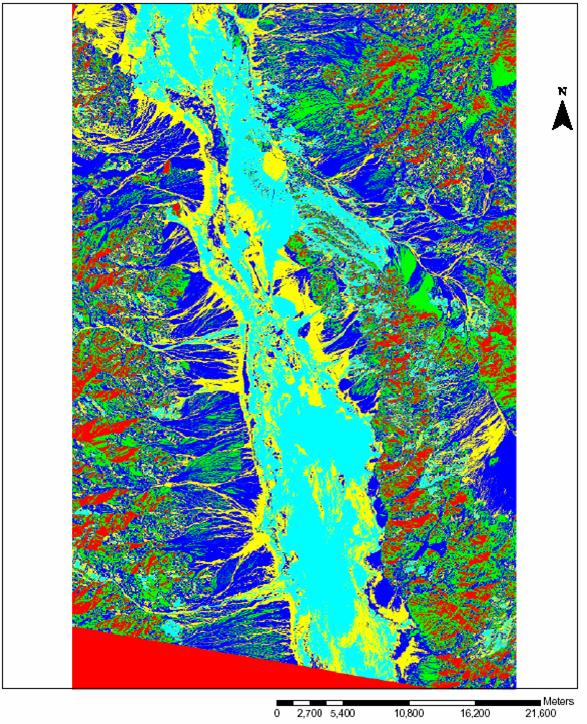
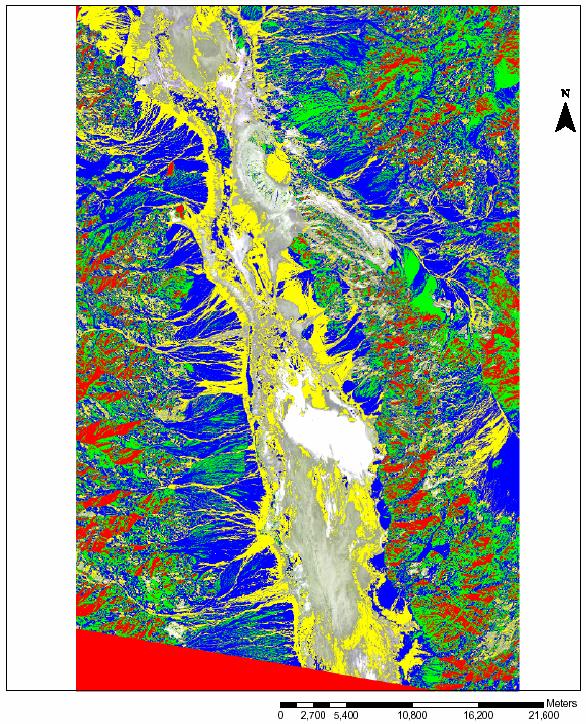
Unsupervised K-Means Classification of ASTER DATA:
Visible Near IR Data, Bands(2,3,1):
5 Class K-Means Classification
![Text Box: Classifiaction Satistics:
File: class2 [289,344 points]
Class Name Npts Pct
---------- ---- ---
Unclassified [0] 0.000%
Class 1 [73361] 25.354% red
Class 2 [42161] 14.571% green
Class 3 [52709] 18.217% blue
Class 4 [50908] 17.594% yellow
Class 5 [70205] 24.264% light blue](images/image014.gif)
The Alluvial Channels appear in Yellow where as the Alluvial Fan Body appears in Blue.
The classification was overlayed on the ASTER data in the next image:
The light blue color representing the valley floor was omitted.
K-Means Classification of ASTER Data in the Thermal IR Range
(RGB=Bands 14,13,12):
5 Class K-Means Classification:
The light Blue Color representing the Salt Bed Valley floor as well as covering the Black Mountain Alluvial Fans was omitted.
The Panamint mountain fans are classified:
· The most recent flows appeared as Blue
· The transition between the most recent flows to the older flows is Yellow.
· Older flows appear in pink.
· Interfan separation takes the light blue color as the valley floor.
Alluvial Fans TIMS Data
Day TIME NIGHT TIME
TIMS Day time and Night time images for the Panamint Mountains Alluavial fans are shown:
· The Older flows are covered with darker Desert Varnish which becomes very hot in the Day and very cool at night.
· The Older flows appear bright in the Day image and dark in the night image
· The more recent flows appear warmer (brighter) in the day than in the night.
· The darker valley at the foot of the fans absorbs heat in the Day and retains it at night, thus looks brighter in the Night image
· The Furnace Creek fan and the saline area around it is warm in the images.
Conclusions:
-
The sources of flows for the fans and fan characteristics could be identified using elevation profiles.
-
Contour Plots show the different elevation contours across the fans.
-
It is hard to identify recent fans from old fans using slope profiles only.
-
Using Decorrelation stretch we could identify the recent flows from the older flows.
-
Different Fan features are classified using K-means classification of ASTER data in Visible Near IR and Thermal IR ranges.
-
Day and Night TIMS provide valuable information for classifying older fan flows from more recent ones.